
This post is part of a presentation ORVI Senior Researcher Ted Boettner made at the Mercer County Indivisible Town Hall on March 17, 2026, at the Karen Preservati Center in Princeton, West Virginia. The title of the town hall was “Why are West Virginia Power Bills So High?”. This post provides a more detailed analysis of this question along with a brief background on West Virginia’s electricity system and the evolution of retail electricity costs in the state over the last 25 years.
Over the last couple of years, there have been numerous news stories about rising electricity costs in West Virginia. Some residents have to pay more for their monthly electric bill than their mortgage payment. Federal data shows West Virginia’s retail electricity rates have grown faster than most states over the past 25 years. West Virginia residents also use more electricity on average than residents of other states, which compounds the problem. There are several central reasons why West Virginia’s electricity rates have soared recently. The short answer is rising coal fuel costs in the global market. The longer answer is below—and more complicated. Before diving into what is driving electricity costs in West Virginia, it is imperative to understand the structure of West Virginia’s electricity system.
West Virginia’s Electricity System, In Brief
There are three main components of the “bulk power system” and electricity costs: generation, transmission, and distribution. Generation includes power plants, transmission includes the high voltage lines that run up and down the hills connected to power plants and to distribution stations, and distribution includes the low voltage lines and wires in your neighborhood that deliver the electricity to your home or business. [1]
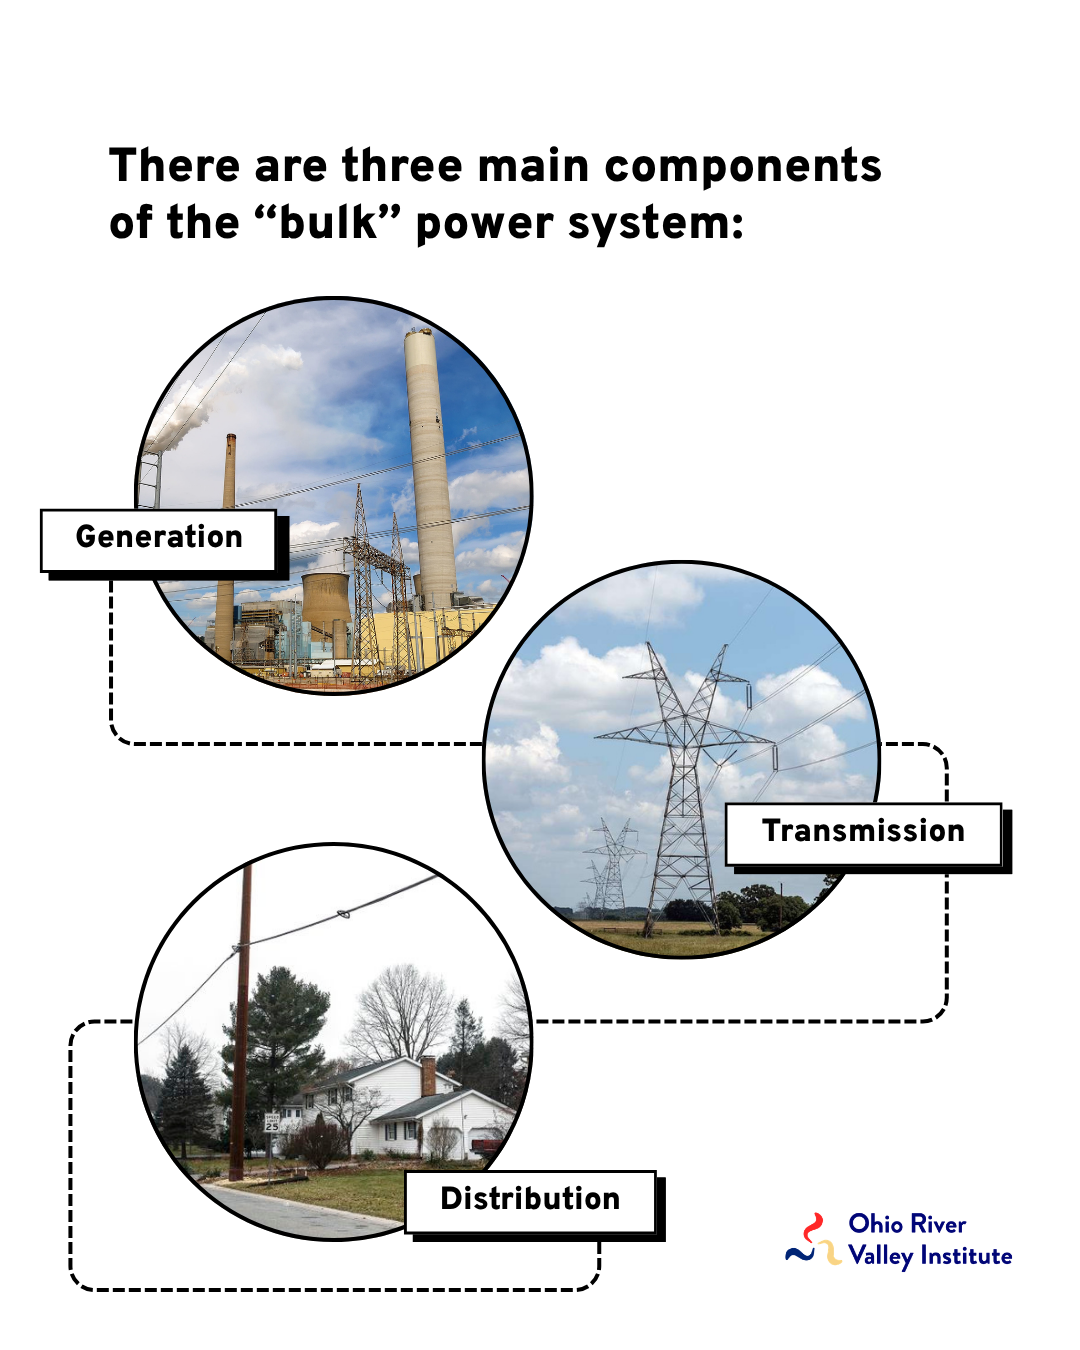
In West Virginia, all three components are vertically integrated (for the most part) under investor-owned utilities that serve captive, in-state customers and that are regulated by the state Public Service Commission (PSC). That’s different than in some “restructured” states, such as neighboring Ohio and Pennsylvania, where there are no state-sanctioned monopolies on generating electricity but there are monopolies on distribution or delivery of electricity. So, customers in Ohio and Pennsylvania choose from competing suppliers of generation, while still relying on local utilities that operate as regulated monopolies for transmission and delivery.
While the public service commission (PSC) in West Virginia regulates and sets retail electricity rates that include all three components of your electricity bill, the Public Utility Commission (PUC) in Pennsylvania approves rates only for the distribution and delivery of electricity. Transmission rates or costs are regulated by the Federal Energy Regulatory Commission since they cross state lines.
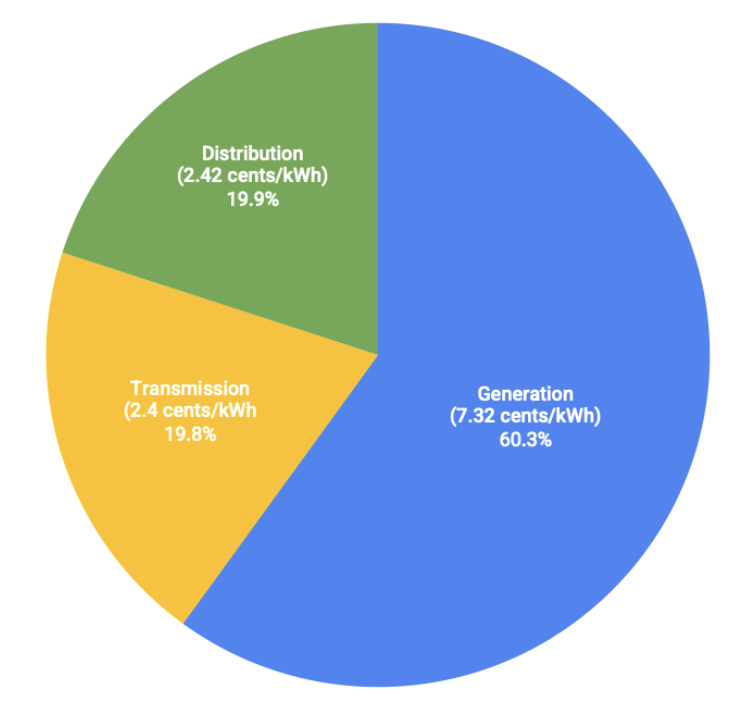
West Virginia’s electric utilities, along with 12 other states and the District of Columbia, are members of the PJM Interconnection, a private, non-profit corporation known as a regional transmission organization (RTO) that operates the grid and has exclusive control over electricity transactions and transmission in interstate commerce. PJM does not produce electricity or own transmission lines, but it manages electricity generation and transmission and dispatches electric power through several wholesale electricity markets (energy, capacity, ancillary). PJM’s basic functions are to ensure grid transmission reliability, provide nondiscriminatory interconnection services for generators, and operate electricity markets. Figure 1 below shows the shares of electricity costs by generation, transmission, and distribution for PJM’s Western Region, which includes all of West Virginia.
Figure 1: Generation makes up more than 60% of electricity costs in West Virginia.
Share of electricity costs in PJM’s Western Region, 2024
Source: US Energy Information Administration, 2025 Annual Energy Outlook, PJM West Region, Table 54, Prices by Service Category for 2024 (Projections)
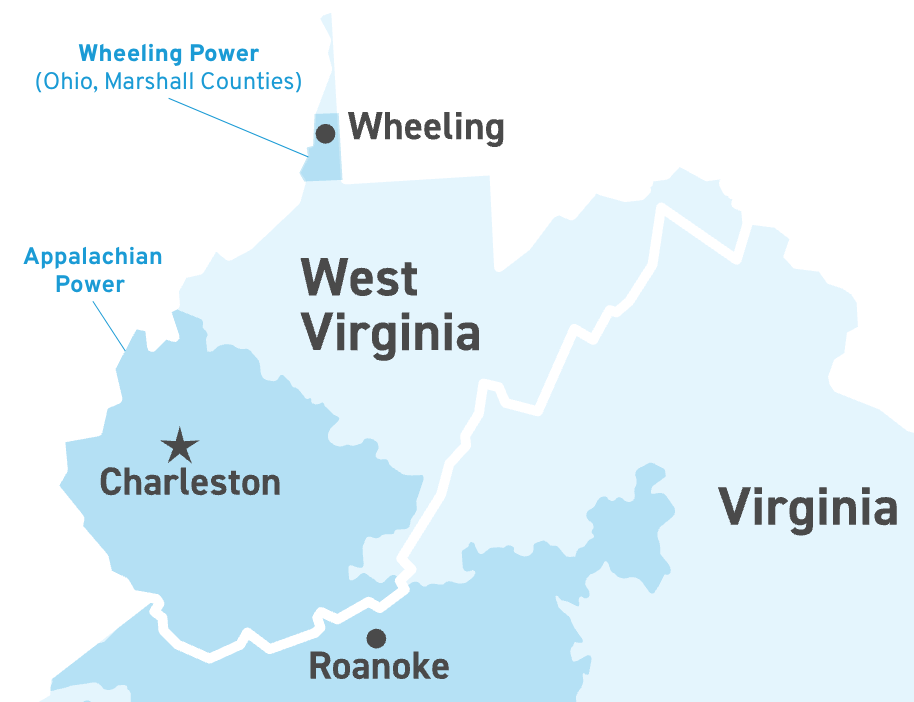
West Virginia is served mainly by four vertically integrated electric utilities owned by American Electric Power (AEP) and FirstEnergy. [2] AEP’s Appalachian Power, which covers the southern part of the state, and AEP’s Wheeling Power, which covers Marshall and Ohio counties in the northern panhandle, serve about 458,000 customers in West Virginia.
AEP’s service area (darker blue):
Source: AEP
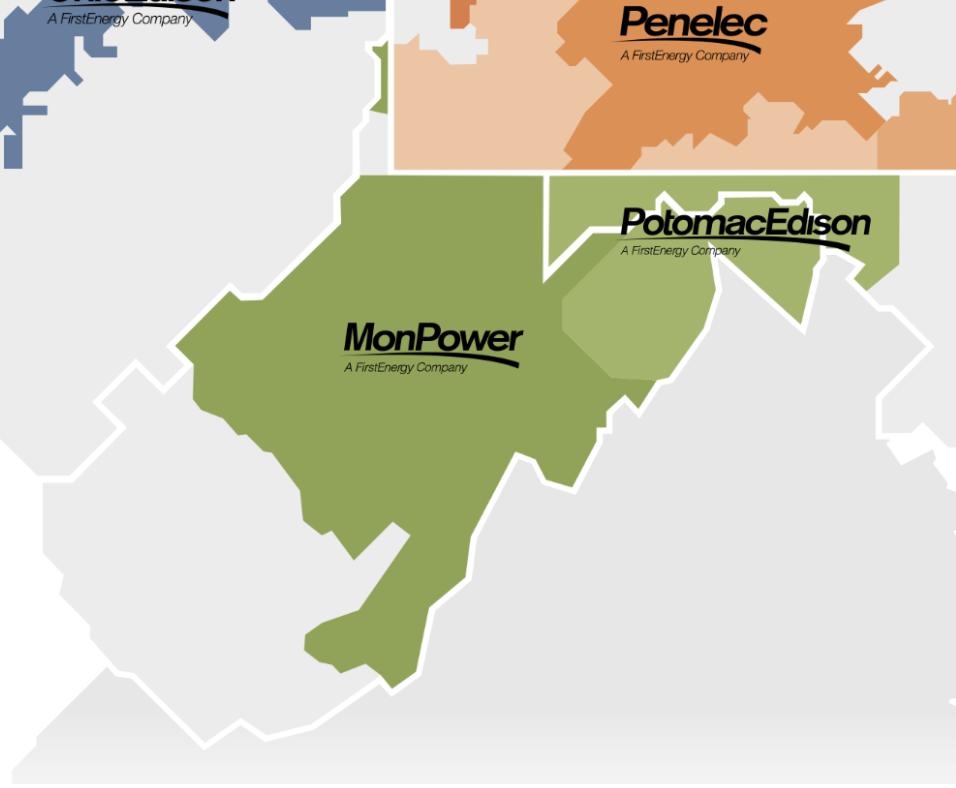
Meanwhile, First Energy’s Mon Power serves most of northern West Virginia and its subsidiary Potomac Edison serves seven counties in the eastern panhandle. Altogether, Mon Power and Potomac Edison serve about 550,000 customers in West Virginia.
FirstEnergy’s service area (green):
Source: FirstEnergy
West Virginia also has several independent power producers (IPPs), which sell electricity on PJM energy markets to utility companies and others inside and outside of the state.
PJM is the world’s largest regional transmission organization (RTO), but it does not produce electricity or own transmission lines—it manages electricity generation and transmission and dispatches electric power. AEP, for example, gave functional control of its 22,300 miles of transmission lines to PJM in 2004. PJM’s basic functions are to ensure grid transmission reliability, provide nondiscriminatory interconnection services for generators, and operate electricity markets.
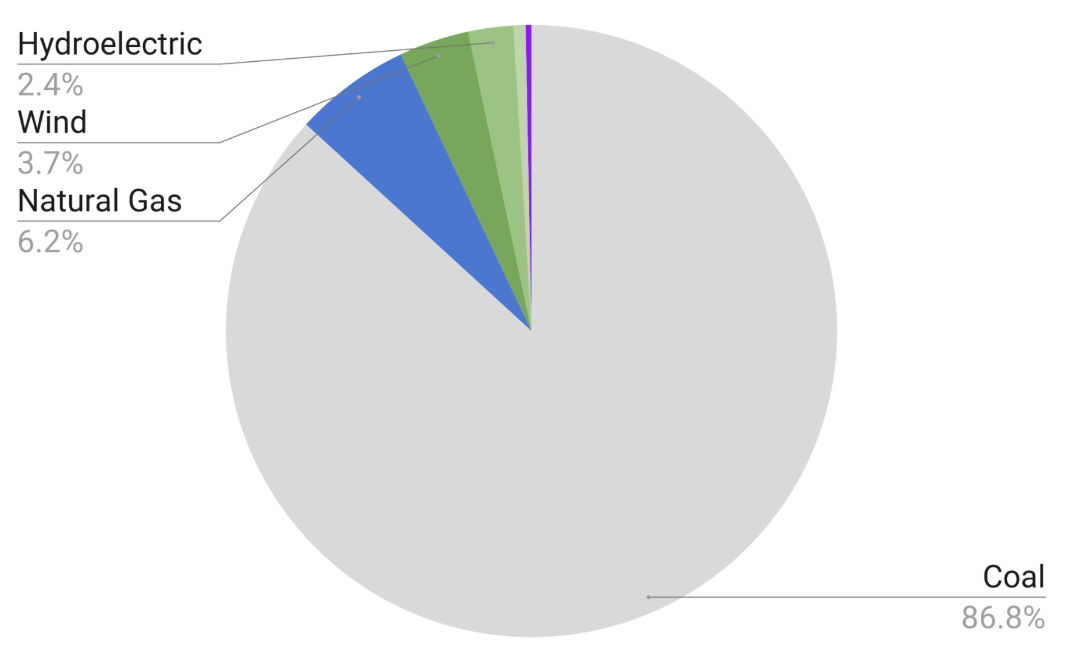
West Virginia’s regulated electric utilities use power mostly from their own power plants, but they also purchase electricity from PJM’s energy markets generated by power plants located inside and outside of the state. Figure 2 below shows West Virginia’s total power generation in 2025 by source. Not surprisingly, coal makes up about 87% of power generation, while renewable energy—wind, conventional hydroelectric, and solar—comprises about 7% and natural gas makes up 6%.
Figure 2: Coal makes up nearly nine-tenths of West Virginia’s fuel mix.
West Virginia’s total power generation by source, 2025
Source: US Energy Information Administration, Electricity Data Browser.
West Virginia’s two main regulated electric utilities produced about 81% of the state’s electric power in 2025. Most retail customers in West Virginia pay American Electric Power (AEP) or FirstEnergy for their electricity, which mostly comes from coal plants, such as the John E. Amos Power Plant in Winfield and the Harrison Power Station in Haywood. AEP and FirstEnergy can also buy and sell power on PJM’s wholesale electricity market and engage in bilateral transactions with other load-serving entities to provide power. However, most of their power is self-scheduled and delivered to in-state customers. In 2025, the state’s regulated electric utilities delivered about 33.7 terawatts of power to in-state customers, comprising about 63% of total electricity generated in the state. Residential deliveries made up one-third of sales, while commercial customers accounted for 24% and industrial customers accounted for another 43%.
About 19% of the electricity produced in West Virginia is from independent power producers, such as Longview Coal Plant in Morgantown and NedPower Wind in Mt. Storm. Their electricity is sold on PJM’s spot market or through agreements with industrial customers. While it is unclear how much of the electricity (electrons) produced in West Virginia is consumed in West Virginia, the state is one of the few states that produces more electricity than it consumes.
The Rapid Growth of West Virginia’s Retail Electricity Costs
While electricity rates are complex and are set by a multitude of factors in West Virginia, they are ultimately approved by the West Virginia Public Service Commission (WVPSC), the body that oversees the state’s regulated electricity providers. There are two central components of electricity rates in West Virginia approved by the WVPSC: base rates and rider charges. The diagram below provides a breakdown of my personal residential electric bill from Appalachian Power for December 2025, which shows an average cost of 15.7 cents per kWh. The base rate charges comprise about 55% of my total electric bill, while riders—the biggest of which is Expanded Net Energy Cost (ENEC)—make up 39%. Taxes are 6% of my bill. (Base rates are reviewed every three years by the WVPSC, while ENEC cases are reviewed annually.)
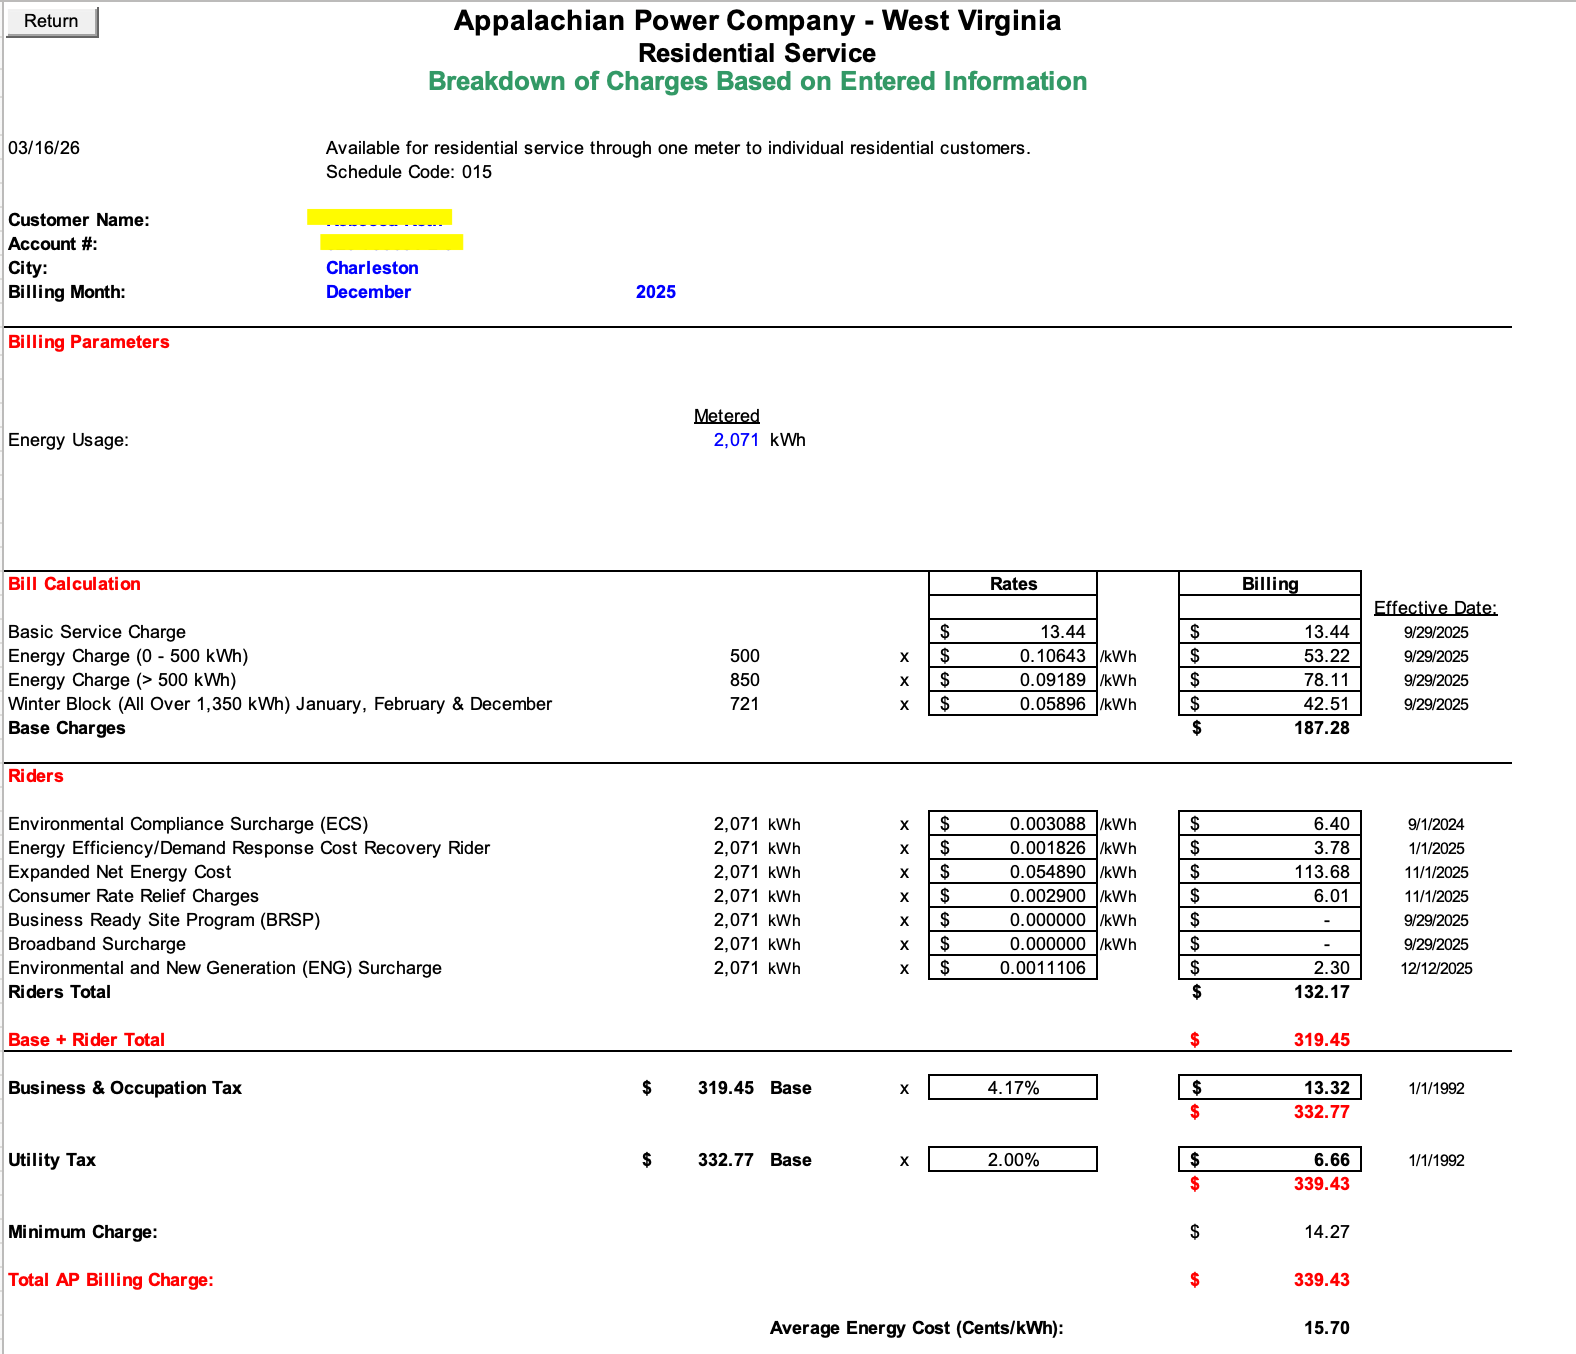
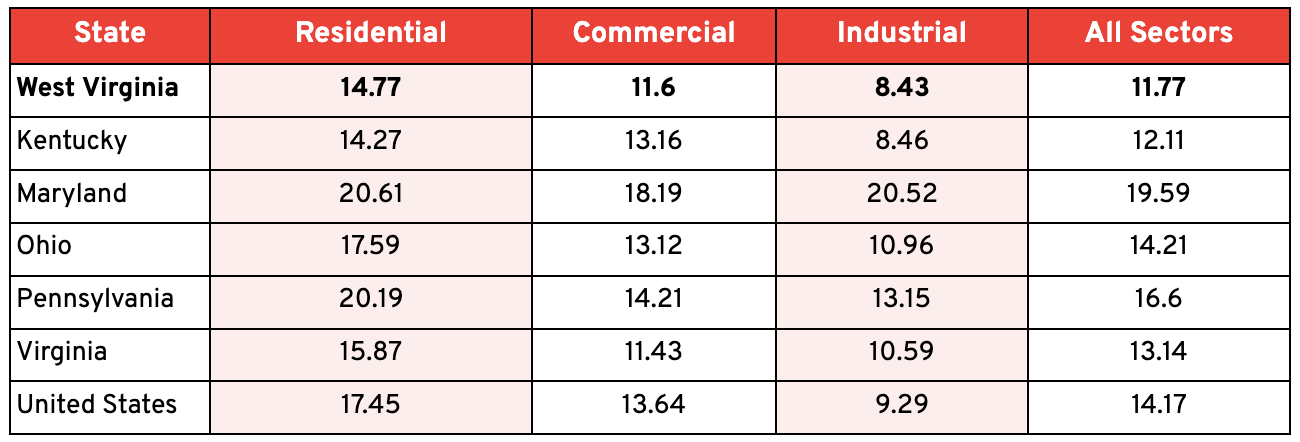
While the above electric bill provides a snapshot and itemization of my residential electricity costs, it is imperative to examine the growth in West Virginia electricity rates over time. Luckily, the US Energy Information Administration (EIA) provides data on the average retail electricity costs per kilowatt hour (kWh) for customers (residential, commercial, and industrial) by state. EIA simply divides the total electricity bills (sales revenue) by electricity usage to arrive at an average cost per kWh. The table below shows the average retail prices in West Virginia, the United States, and bordering states using the latest EIA data (January 2026). For January 2026, West Virginia average electricity rates were lower than all neighboring states and the US average for customers but ranked second lowest for residential rates among bordering states. However, West Virginia’s residential electricity rate was much higher in the summer and early fall (16.14 cents per kWh in October), perhaps reflecting the lower winter rates (as shown in my power bill above).
Table 1: Across sectors, West Virginia’s electricity costs are lower than neighboring states and the US average.
Average Retail Electricity Cost by Sector, Cents per Kilowatt Hour, January 2026
Source: US Energy Information Administration, Monthly Electric Power Monthly, Table 5.3
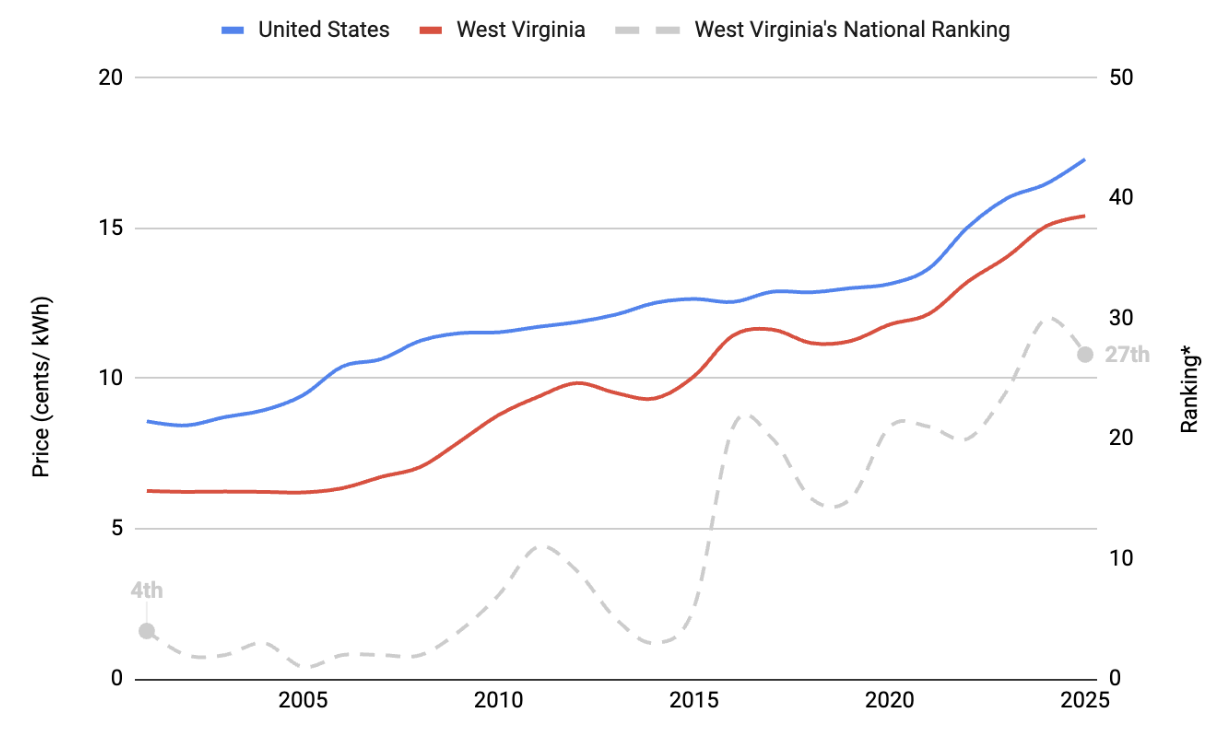
Looking at annual average electricity rates, Figure 3 below shows electricity rates for residential customers for the United States and West Virginia over the last 25 years. From 2001 to 2025, West Virginia’s average residential electricity rates grew by 146%, compared to 102% nationally. Only four other states experienced larger growth in electricity rate increases over this time. Maryland is the only neighboring state with faster-growing electricity rates over this 25-year period. West Virginia had the lowest residential electricity rates in the country in 2005. However, by 2025, 26 other states had lower rates, including Virginia and Kentucky.
Over the last ten years, West Virginia residential electricity rates have grown by 53%, much faster than neighboring states (eclipsing Ohio’s 32% growth rate, Pennsylvania’s 42% rate, and Virginia’s 34% rate) and the US average. One potential reason is that our neighboring states (except Maryland) have shifted from coal to natural gas. For example, in 2010 Ohio produced about four-fifths (82%) of its power generation from coal, compared to about 21% today. Meanwhile, natural gas has grown from 5% to 60% of electric generation in Ohio over this time period.
Figure 3: West Virginia, once home to the fourth-cheapest retail electricity prices in the US, has fallen to 27th.
Average retail electricity prices, West Virginia and US (including West Virginia’s national electricity price ranking), 2000-2025
* 1 = cheapest.
Source: US Energy Information Administration, Electric Power Monthly
While West Virginia has lower residential electricity rates than the US average and most neighboring states, residential households in West Virginia use more electricity than other states. This is mostly because of the state’s older, less insulated housing stock, which consists mostly of single-family homes. In 2025, the average monthly electricity bill for residents was about $165 (1,073*15.41 cents) compared to a US average of $152 (878*17.3 cents). West Virginia uses about 22% more electricity per residential household than the US average, and consumes more energy (gas and electric) per household than the national average. The average annual electric bill in West Virginia is about 3% ($1,984/$63,150) of median household income, compared to about 2% ($1,823/$83,730) nationally.
The electricity rates and average bills can differ greatly by which utility provider you have in West Virginia. According to a new electricity price hub, the average electricity rate in March of 2026 for Mon Power customers was 13.8 cents per kWh compared to 17.2 cents per kWh for Appalachian Power customers. Meanwhile, the average bill was $135 per month compared to $216 per month, respectively. Over the last five years, the average electricity rate for each of these two electric utilities grew at similar rates, 31% (Mon Power) compared to 25% (ApCo).
Why are West Virginia’s electricity rates growing faster than other states?
There are several reasons why the state has seen above-average growth in retail electricity rates over the last decade. The state has seen a sharp decline in electricity production over the past 20 years, which means the state is exporting less electricity (which helps lower in-state costs). The decline in power generation is the result of aging coal plants that make up the vast majority of generation. These plants have seen capacity decline as other states stopped buying the state’s coal fired electricity. West Virginia has also been hammered by rising coal fuels costs since 2007 as other states shifted away from coal. These rising costs of coal have been mismanaged by one of the state’s regulated electricity utilities as old coal plants have been transferred to in-state customers. Environmental upgrades to old coal plants have also led to higher prices, along with state policies that have mandated the use of more coal plants to serve in-state customers.
1. Producing and Selling Less Power
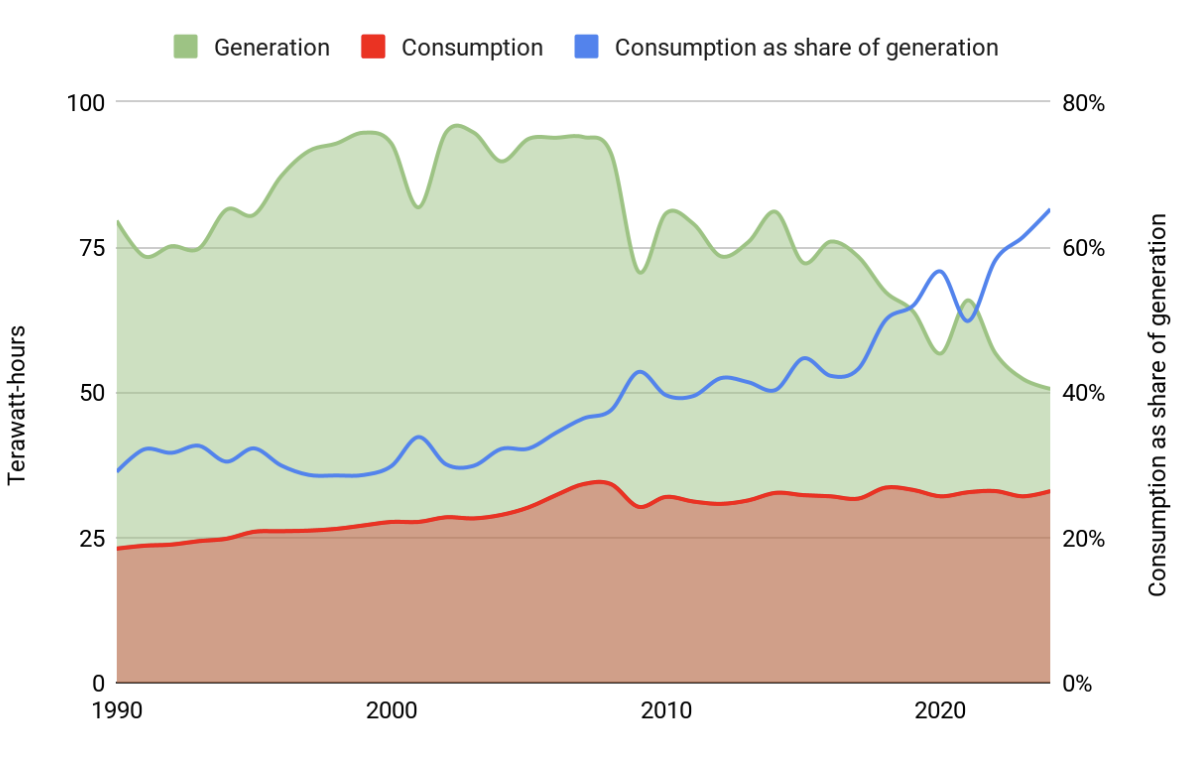
West Virginia is producing and exporting a lot less electricity today than it was three decades ago. From its 2002 peak through 2024, net electricity production declined by 47%, from 95 terawatt hours to 51 terawatt hours. In 2002, West Virginia consumed about 30% of the electricity generated in the state; in 2024, that number was 65%. So, while West Virginia still produces more electricity than it consumes, the state is producing a lot less electricity today.
Figure 4: West Virginia is producing—and exporting—much less electricity.
West Virginia’s power generation, consumption, and consumption as a share of generation, 1990-2024
Source: US Energy Information Administration, Electric Power Monthly
For example, Appalachian Power/Wheeling Power had about $541 million in off-system sales of electricity it sold to other states (and perhaps some to Mon Power) in 2008, compared to just $46 million in 2024. These off-system sales—mostly power sold out of state—helped keep in-state electricity rates lower. When the state’s regulated electricity utilities can sell power onto the PJM wholesale markets, it has the potential to offset costs for in-state customers by increasing revenue. These off-system sales are credited against increases in annual fuel expenses (ENEC expenses) that can lower rate increases.
The question of why West Virginia is producing less electricity is answered below.
2. Coal Plant Capacity Shrinking, Aging, and Running Less
The sharp decline in generation and in off-system sales in West Virginia is due to several compounding factors. First, over the last several years the state has retired several coal plants. Total generation capacity (net summer) has declined from 16.5 gigawatts (GW) in 2005 to 15.1 GW. The average age of the state’s coal plants is around 50 years. As plants age, they physically degrade and become less efficient. In addition to age, the coal plants are most exposed to being dispatched out of merit order by cheaper gas and renewable generation. The restructuring of electricity markets in the late 1990s has led to more gas and renewables on the grid, which has been hard on coal plants and nuclear plants that are not made to start and stop frequently, causing cycling damage. Operators of these aging coal plants often also scale back investments when the plants get closer to their end of life. So aging plants raise costs and reduce output, worsening the economics in both directions.
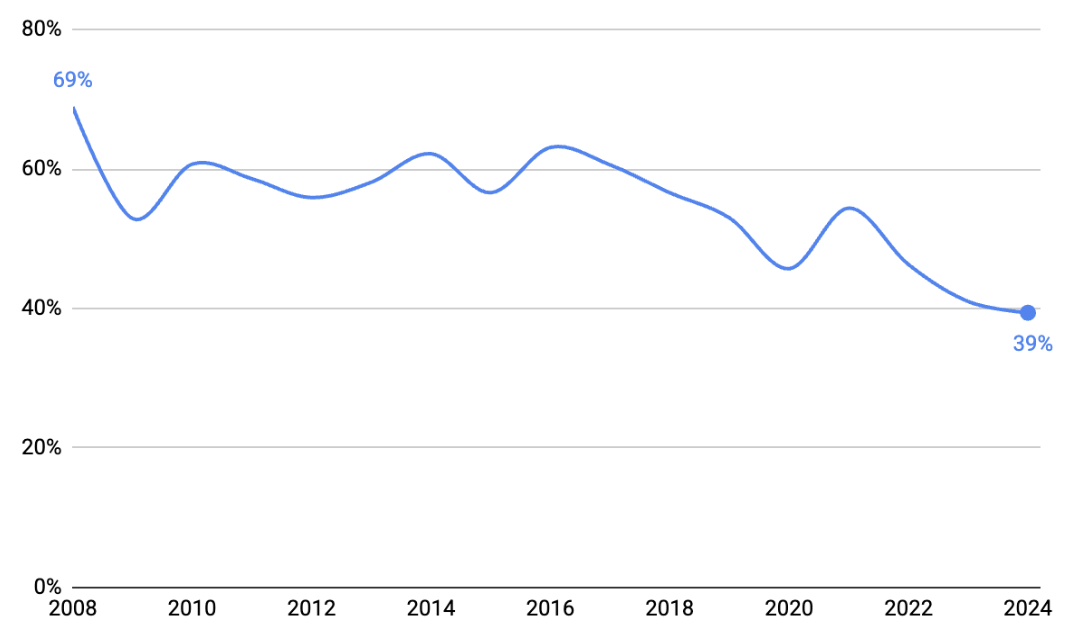
This is best seen by looking at the capacity factor of coal plants in West Virginia, which make up about 90% of power generation in the state. The capacity factor, or the amount of electricity produced as a share of potential output (nameplate capacity) in a given year, has plummeted for coal plants in West Virginia. For example, in 2008 coal plants ran 69% of the time compared to just 38% in 2024. While coal plants have aged over this time and have become less efficient, this is not the central reason for the declining capacity factor and generation. One example that highlights this is Longview Power Plant near Morgantown, West Virginia, which is an independent power producer and one the nation’s newest coal power plants, built in 2011. Longview still operates but filed for bankruptcy in 2020, citing “cheap natural gas” in the PJM energy market that depressed power prices.
Figure 5: West Virginia’s coal plants are operating at a lower capacity.
Capacity factor of West Virginia’s coal plants
Source: US Energy Information Administration, Electric Power Monthly
3. Natural gas competition
The shale natural gas revolution that began about 15 years ago in Appalachia has been a larger driver of making West Virginia’s coal-fired power plants economically uncompetitive. When cheap natural gas flooded the market, neighboring states shifted to building more efficient gas plants and closed many coal plants. The new gas-generated electricity that was pushed into the wholesale energy markets on PJM pushed prices downward and coal became less competitive. The irony is that much of that cheap Marcellus gas came from West Virginia.
Coal’s share of generation within PJM fell from roughly 44% in 2013 to under 14% today, replaced almost exclusively by gas combined-cycle plants. As West Virginia’s neighboring states shifted from coal to gas, they no longer relied on West Virginia’s more expensive coal power plants for electricity. As discussed previously, natural gas is replacing coal in PJM markets, which are more conducive to natural gas and renewable energy than baseload coal or nuclear power. The push to lower carbon emissions over the last decade has also made natural gas a more preferred fuel source of utilities as coal plants have had to undergo extensive environmental upgrades to remain federally compliant.
4. Environmental compliance upgrades
In 2021, the WVPSC approved about $448 million in environmental upgrades for three coal plants—Amos, Mountaineer, and Mitchell, owned by Appalachian/Wheeling Power—to comply with EPA requirements regarding wastewater and coal ash (effluent limitation guidelines and coal combustion residue rules), allowing the plants to continue operating through 2040. These upgrades were approved despite Appalachian Power’s own testimony showing that retirement of the Mitchell plant would save ratepayers $27 million per year. (The cost of these upgrades is highlighted in my electric bill above as “environmental compliance surcharge”.)
5. Rising Fuel (Coal) Costs
Large swings in coal costs over the last decade and a half coupled with the mismanagement of coal deliveries by Appalachian/Wheeling Power have led to large electricity rate increases in West Virginia. Nationally, the cost of coal delivered to electric power plants rose sharply from 2007 to 2010, from $35 to $45 per ton. The second large spike in coal prices was in 2022—which was a result of rising energy prices from the fallout of the Ukraine War—where prices rose from $38 per ton in 2021 to $47 per ton by 2023. In West Virginia, the cost rose from $48 a ton in 2018 to $71 a ton in 2025.
The spike in coal prices in 2008 led Appalachian/Wheeling Power to incorporate a rider charge called the “consumer rate relief charge” in 2013, which is included in my electric bill above, and was established through the sale of $380.3 million in bonds approved by the WVPSC. The bond is expected to be paid off by 2028.
The second major increase in electricity charges for Appalachian/Wheeling Power customers in West Virginia was in 2024, when the WV PSC approved $321 million ($39 million per year) in rate recovery from fuel costs from coal. The fuel increases came from the sharp rise in coal prices and the mismanagement of coal contracts by Appalachian/Wheeling Power. The WVPSC determined that $232 million of the $553 million sought by Appalachian/Wheeling Power could have been saved had the company acted prudently.
Conclusion
West Virginia’s retail electric power rates have risen sharply over the past decade, driven by the state’s aging coal plants and the restructuring of electricity markets that have favored natural gas. Compounding this has been large increases in coal fuel costs, which have led to additional charges on customers’ electric bills, along with expensive environmental compliance upgrades to coal plants. The sharp decline of in-state electricity production, which has led to a massive drop in off-site electricity sales out of state, has also contributed to cost increases for in-state consumers. There are also large differences in retail electricity prices and bills between the state’s two main electricity utility companies.
Going forward, the West Virginia legislature has been pushing for regulated coal plants in the state to produce 69% of the time, despite concerns from Appalachian Power that this isn’t feasible or economical. The push to produce more electricity from in-state coal plants—despite the risk of higher electricity costs—was put in stark relief last month when the chair of the WVPSC, Charlotte Lane, asked state legislators, “if it costs more to run the coal-fired plants than buying off the PJM market, do you want those plants to run and pass those costs to ratepayers?”
This question gets to the heart of the current impasse on growing electricity rates in West Virginia. Are West Virginians okay with paying higher electricity rates, since some of the coal that is mined in the state feeds that state’s coal plants? Or should the state work to ensure that ratepayers pay the lowest rates possible?
If it costs more to run the coal-fired plants than buying off the PJM market, do you want those plants to run and pass those costs to ratepayers?
West Virginia coal production value has shifted from steam to metallurgical (met) coal—met coal is responsible for more than 60% of the total coal value in the state—over the last decade as surrounding states have purchased less West Virginia coal and shifted away from coal-fired power plants. Nearly all of the state’s coal-fired power plants are expected to be retired over the next 15 years. While Governor Morrissey wants to double down and build new coal plants, this strategy is highly unlikely to yield lower electricity costs in the future because coal plants face high capital costs, regulatory uncertainties, and financing challenges. While the Trump administration is aiming to provide $625 million in investments for existing coal plants in the United States, including West Virginia, the plants will eventually have to be retired. The question, then, is what will replace the plants—if anything?
[1] There is also a lot of associated equipment (e.g. transformers) in each component of the three part system.
[2] There are three other small electric utilities in West Virginia—Black Diamond Power, Harrison Rural Electrification Association, and Craig-Botetourt Electric Cooperative—that serve a couple thousand customers in the state.